


Candlestick charts for Flutter, with indicators, drawing tools and a library of
other chart types. Pure CustomPainter — no WebView, no JavaScript bridge.
Free for any use, with no paid tier.
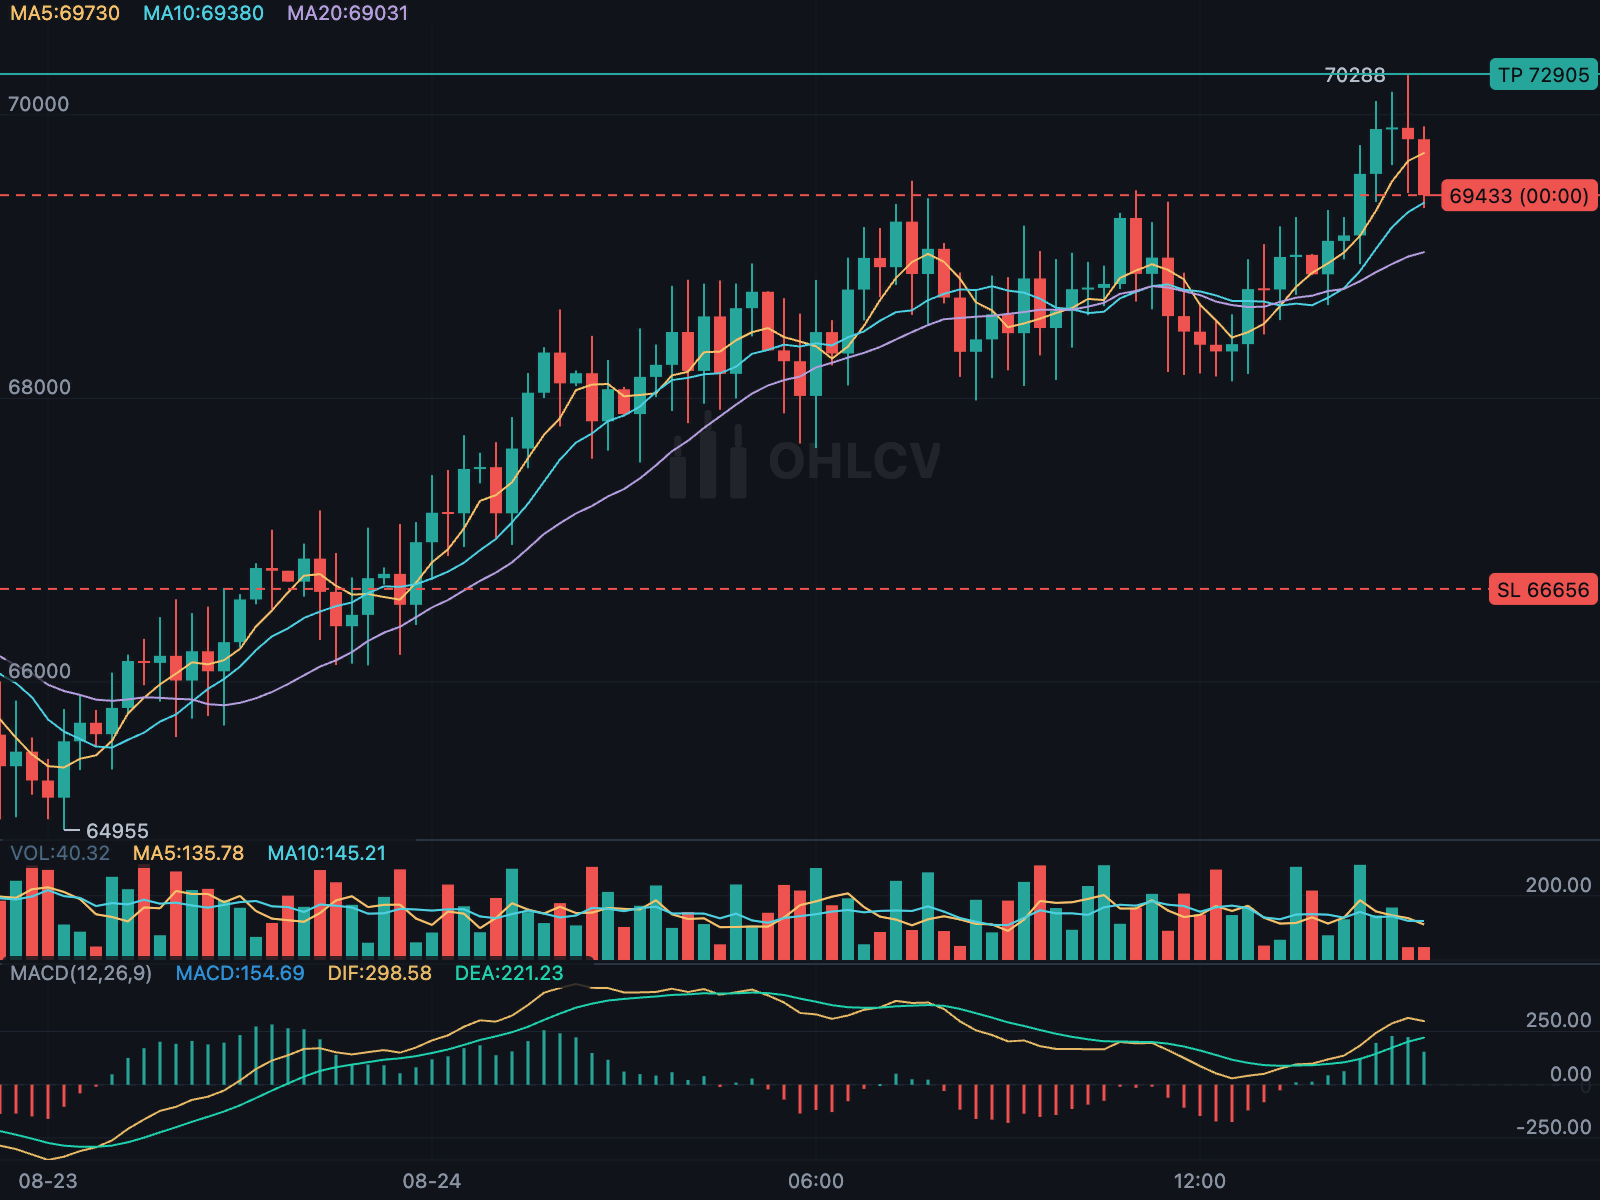
- Candlestick chart — eight chart types, Heikin-Ashi, Renko, Kagi and more, four price scales, sessions, comparison overlays and bar replay.
- 31 indicators — overlays and stacked panes, each a configured instance, with higher-timeframe values that never repaint.
- 29 drawing tools — Fibonacci, channels, patterns and positions, with an editor, undo/redo, alerts and JSON persistence.
- 55 more chart widgets — series, pie, heatmap, treemap, sankey, depth, order flow, volatility and futures curves, risk and portfolio charts, the charts a backtest report is made of, and charts for training and serving language models.
- Fully themeable —
ChartStyle,ChartColorsandChartTranslations.
See the full feature list and the gallery.
Note
This package has grown large. To keep it fast and focused, the next update
will split it into separate packages. ohlcv_chart will keep only the
candlestick (OHLCV) chart, its indicators and its drawing tools; the other
chart widgets will move to their own packages.
dependencies:
  material_ui: ">=1.0.0 <2.0.0"
  ohlcv_chart: ">=3.2.0 <4.0.0"
Requires Dart 3.12 and Flutter 3.44 or later. Widgets are built on the
material_ui package rather than the Material library that used to ship in the
Flutter SDK, so import package:material_ui/material_ui.dart where your app
imported package:flutter/material.dart.
Pass a list of KLineEntity to KChartWidget. Call DataUtil.calculate first
so the indicator values are populated:
import 'package:ohlcv_chart/ohlcv_chart.dart';

DataUtil.calculate(candles);

KChartWidget(
  candles,
  ChartColors(),
  timeFrame: const Duration(minutes: 15),
  indicators: [MaIndicator(period: 20), MacdIndicator()],
  fixedLength: 2,
);
The example app demonstrates every option in the package.
Screenshots and a reference page for every chart are in the gallery.
- Chart types — candles, Heikin-Ashi, Renko, Kagi and more, symbol comparison, bar replay
- Indicators — 31 overlays and stacked panes, panes
- Drawing tools and trading — 29 drawing tools, line editor, orders and positions, event marks
- Series, pie, radar, heatmap and depth — series, pie and radar, heatmap, depth
- Dashboards and reports — treemap, sunburst, sankey, chord, marimekko, stream, parallel coordinates, slope and bump, bubble, box plot, histogram, violin and ridgeline, dumbbell, bullet, gauge, waffle, funnel, sparkline grid
- Progress and goals — progress bars and progress cards
- Order flow and derivatives — market profile, footprint, order-book heatmap, cumulative delta, liquidity map, open interest and funding, options payoff, volatility curves, volatility surface, pair spread, futures curve
- Backtests and results — equity curve, Monte Carlo fan, R-multiple, trade timeline, seasonality, calendar, waterfall, MAE / MFE, value at risk, efficient frontier, activity clock
- Training — training curves, scaling laws, hyperparameter sweep, training timeline
- Evaluation — benchmark matrix, model cost against quality, evaluation breakdown
- Serving and tokens — latency bands, token usage, token heatmap
- Axes, sessions and layout — price axes, date axis, sessions, sizing, theming
- Interaction — legend and crosshair, long-press readout, driving the chart
- Documentation index — a reference page per feature
- Features and gallery
- Changelog — what changed in each release
- Migrating from 1.x and from fl_chart and candlesticks
Bug reports and pull requests are welcome — see
CONTRIBUTING.md. If the package is useful to you, a star
on the repository or a like on
pub.dev helps others find it.
Released under the MIT License. See LICENSE. The rendering core is
derived from the open-source k_chart package and has since been substantially
extended.